Interface overview
This page describes the main areas of the OM Core interface. The GUI and TUI share the same core areas, although they are rendered differently.
Model Browser
The Model Browser is the left panel. It shows the semantic structure of the model as a tree:
- Dimensions — the axes of the model, such as Time, Account, or Product.
- Cubes — multidimensional arrays defined by their dimensions.
- Views — named projections of cubes for display in the grid.
The Model Browser is a navigation view of the model's semantic structure. Expanding a dimension shows its dimension items. Expanding a cube shows its dimensions. Selecting a view opens it in the Matrix Grid.
Matrix Grid
The Matrix Grid is the center of the workspace. It displays the active view as a table:
- Rows and columns are dimension items, not cell coordinates.
- Each cell is addressed semantically, for example
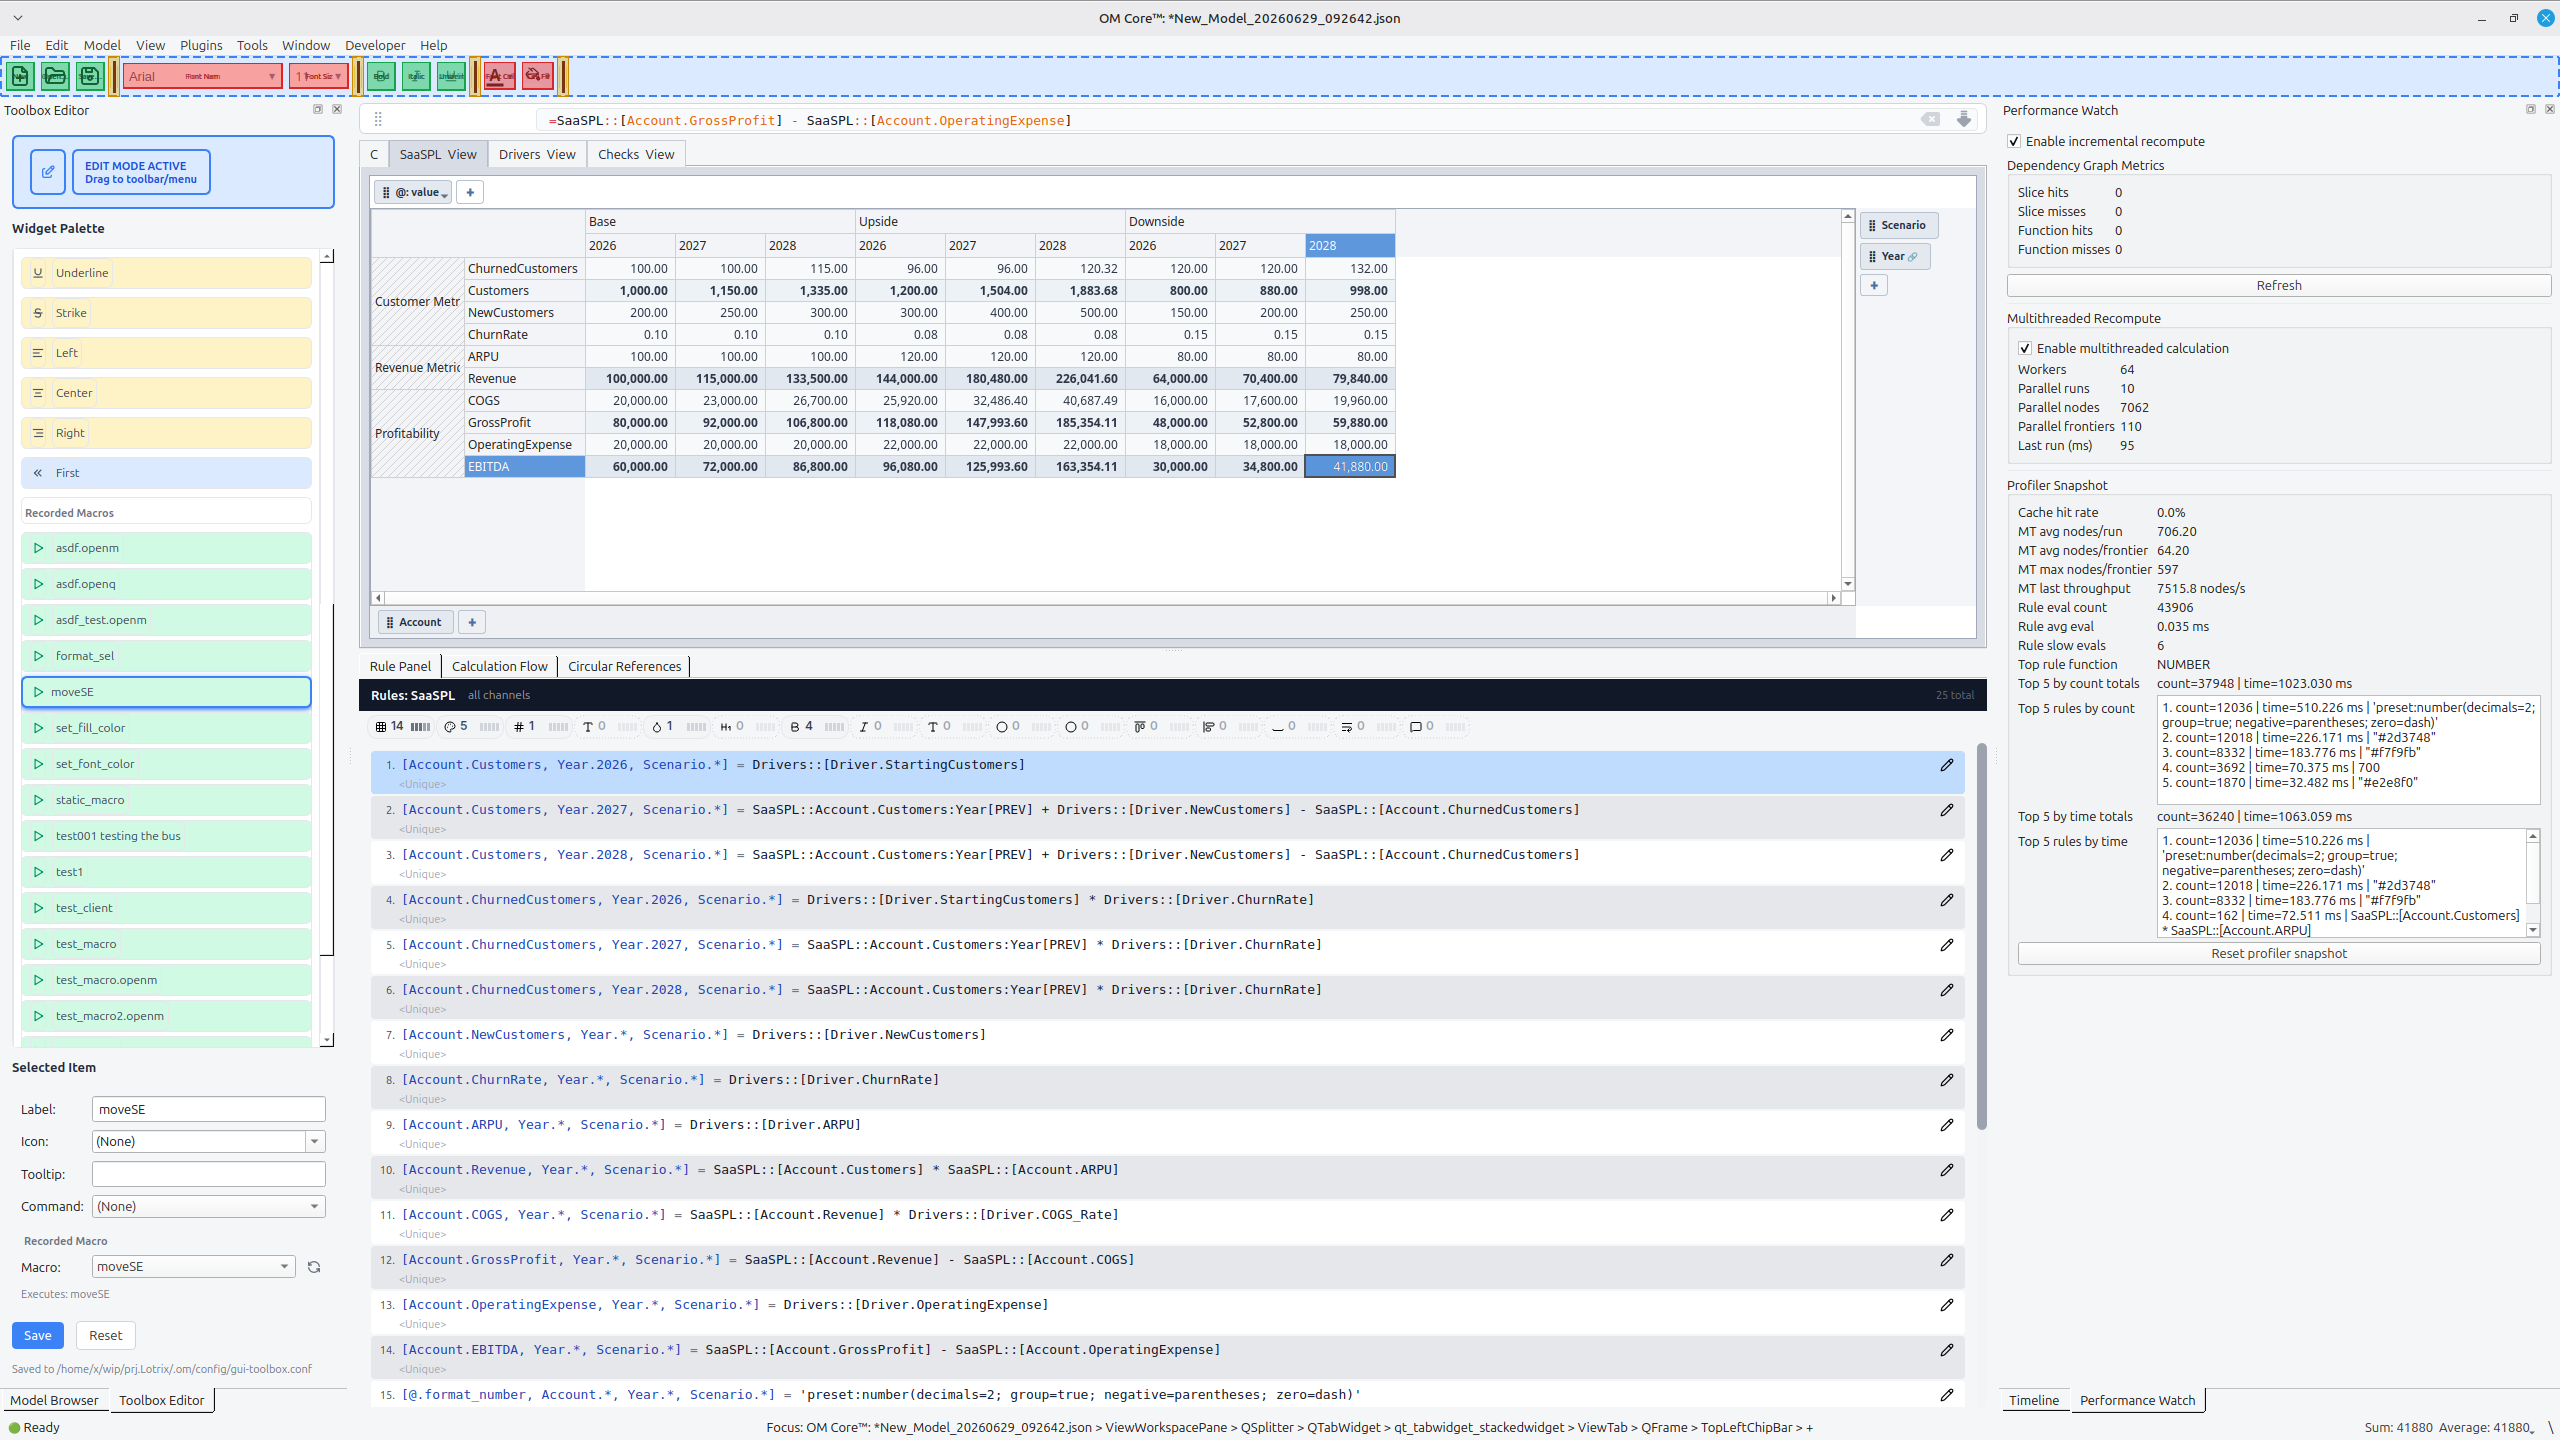
Cube::Dim1.Item1:Dim2.Item2(the value channel is implied). - The toolbar above the grid offers style controls, such as font style, color, and alignment. These controls create style rules under the hood using channels like
@.filland@.font_color. - You can select cells with the mouse or keyboard to inspect or edit them.
Unlike a spreadsheet, the grid is a view on top of the model. The same cube can be rendered in many different views without changing the underlying data.
Rule Panel
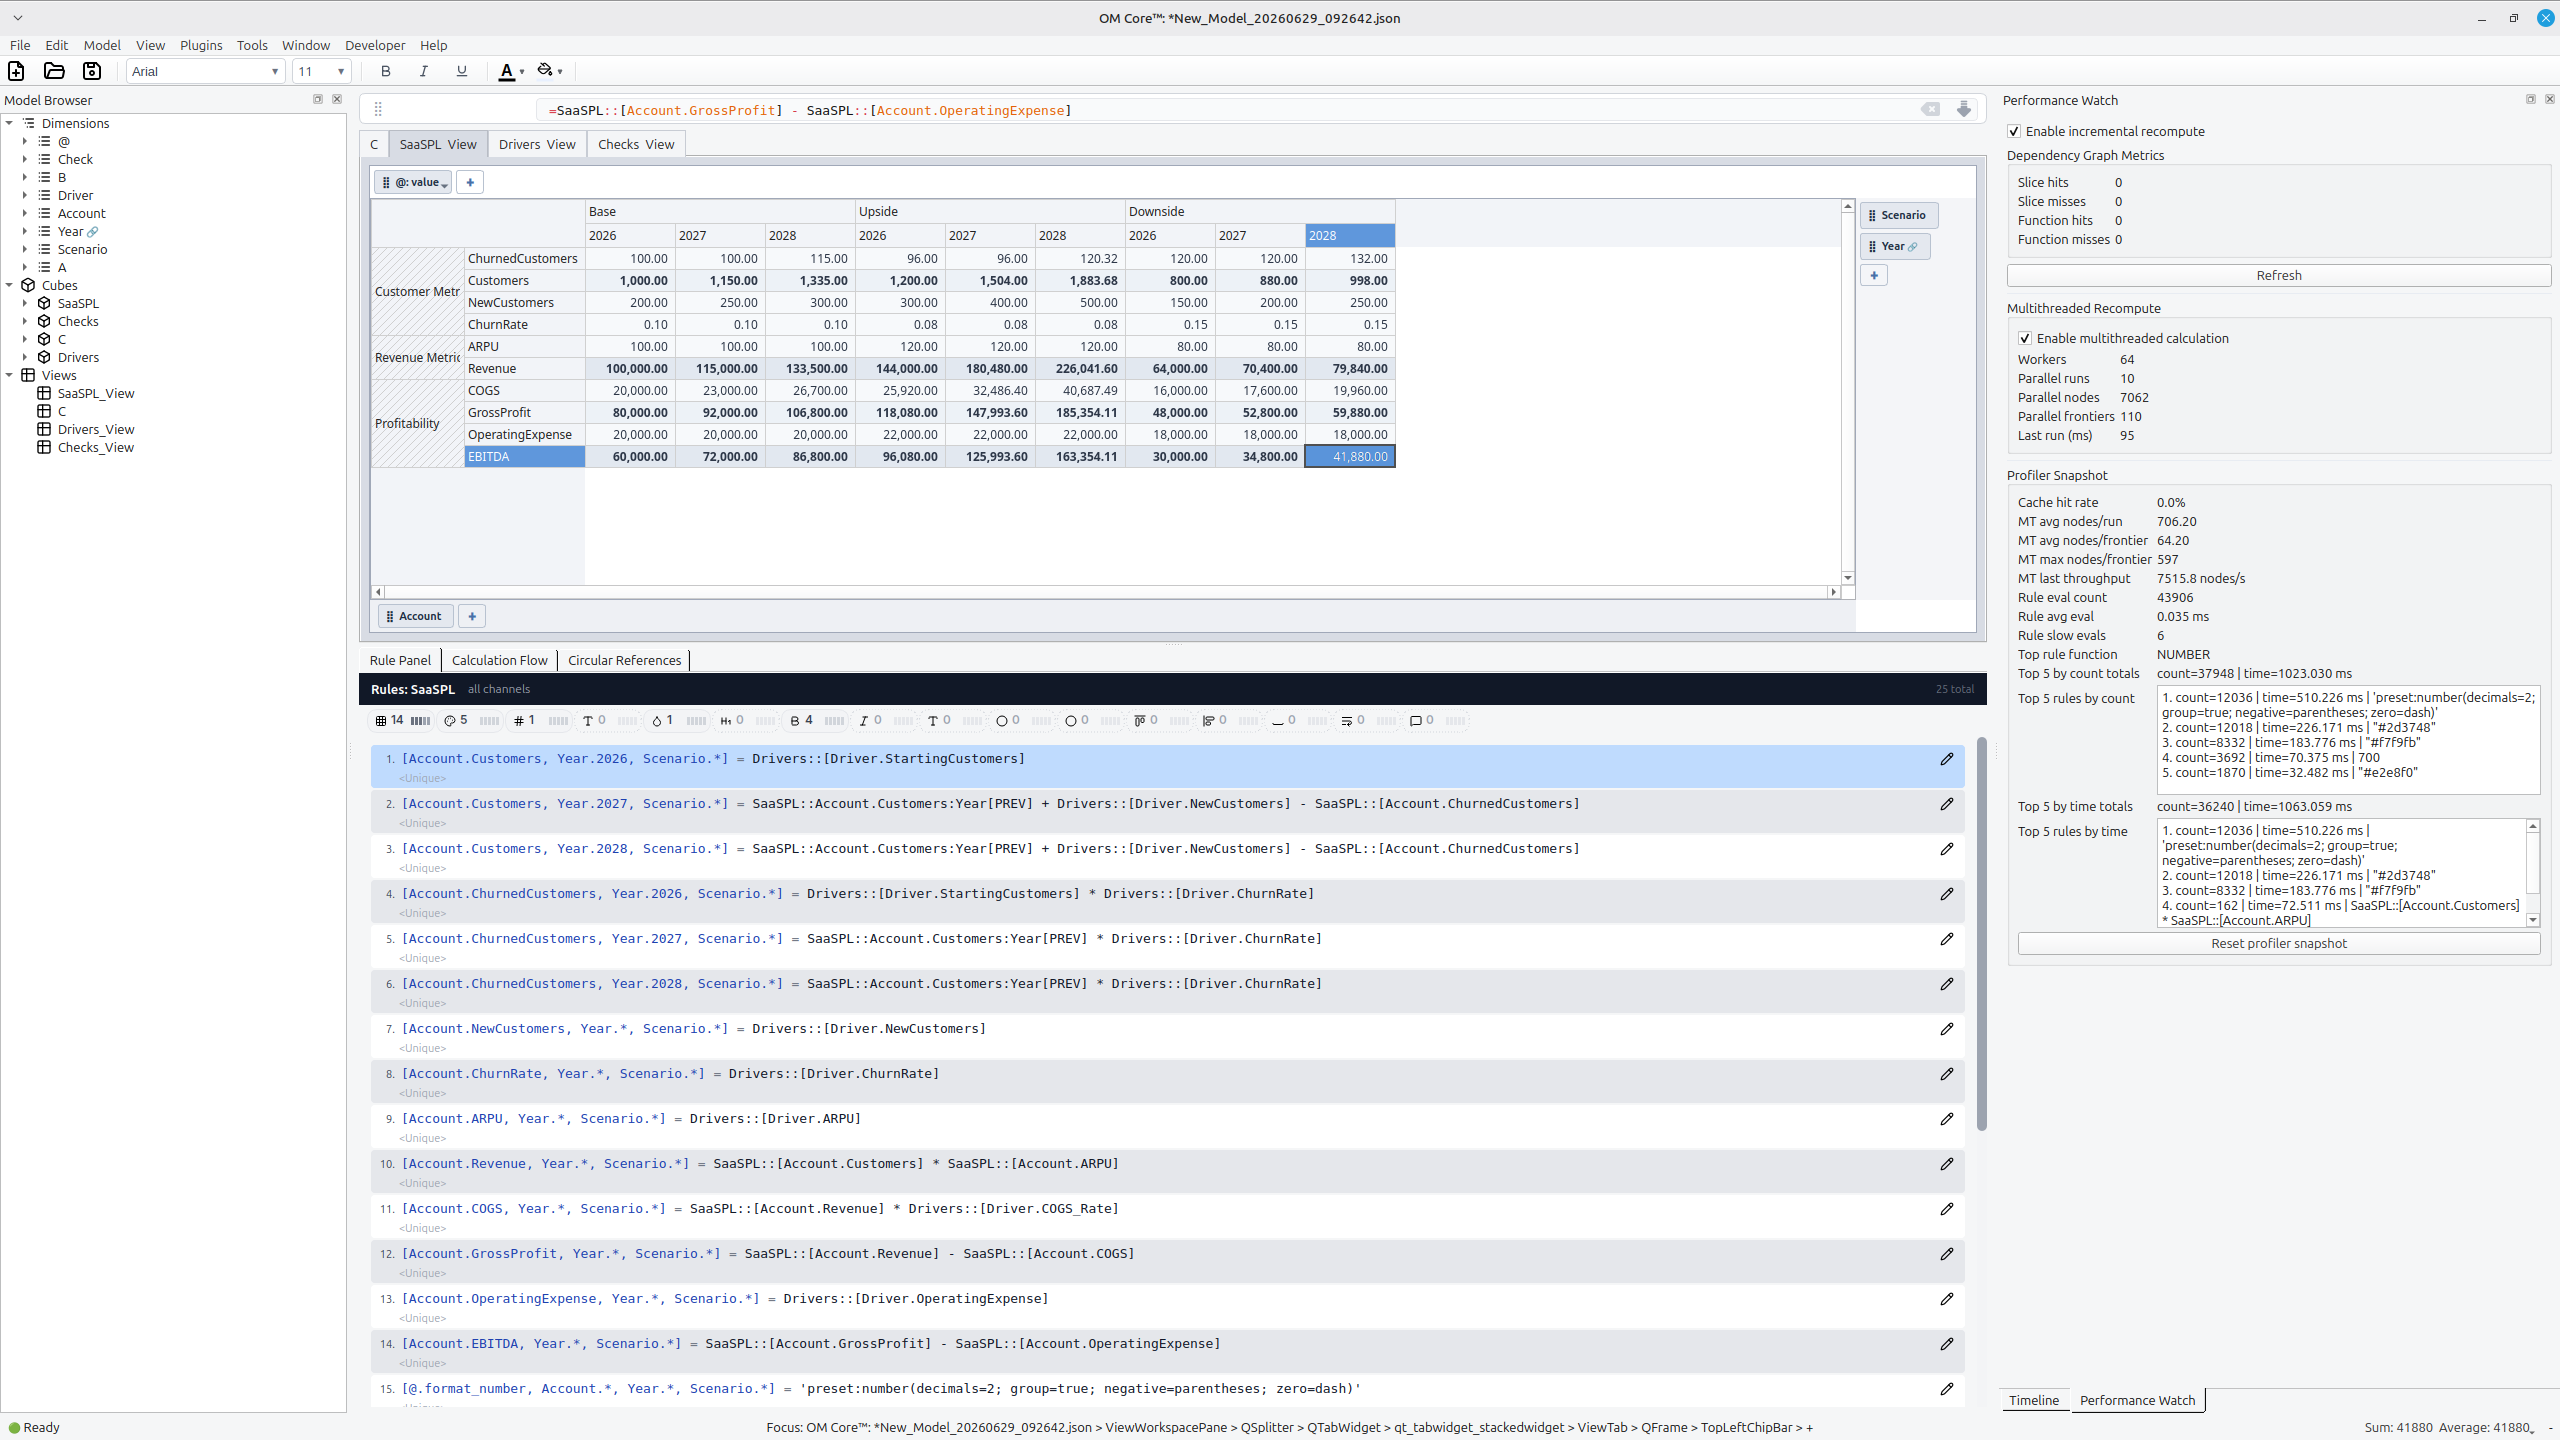
The Rule Panel is at the bottom of the window. It is where you create, inspect, and edit rules.
It has three tabs:
- Rule Panel — the list of rules for the current cube or selection.
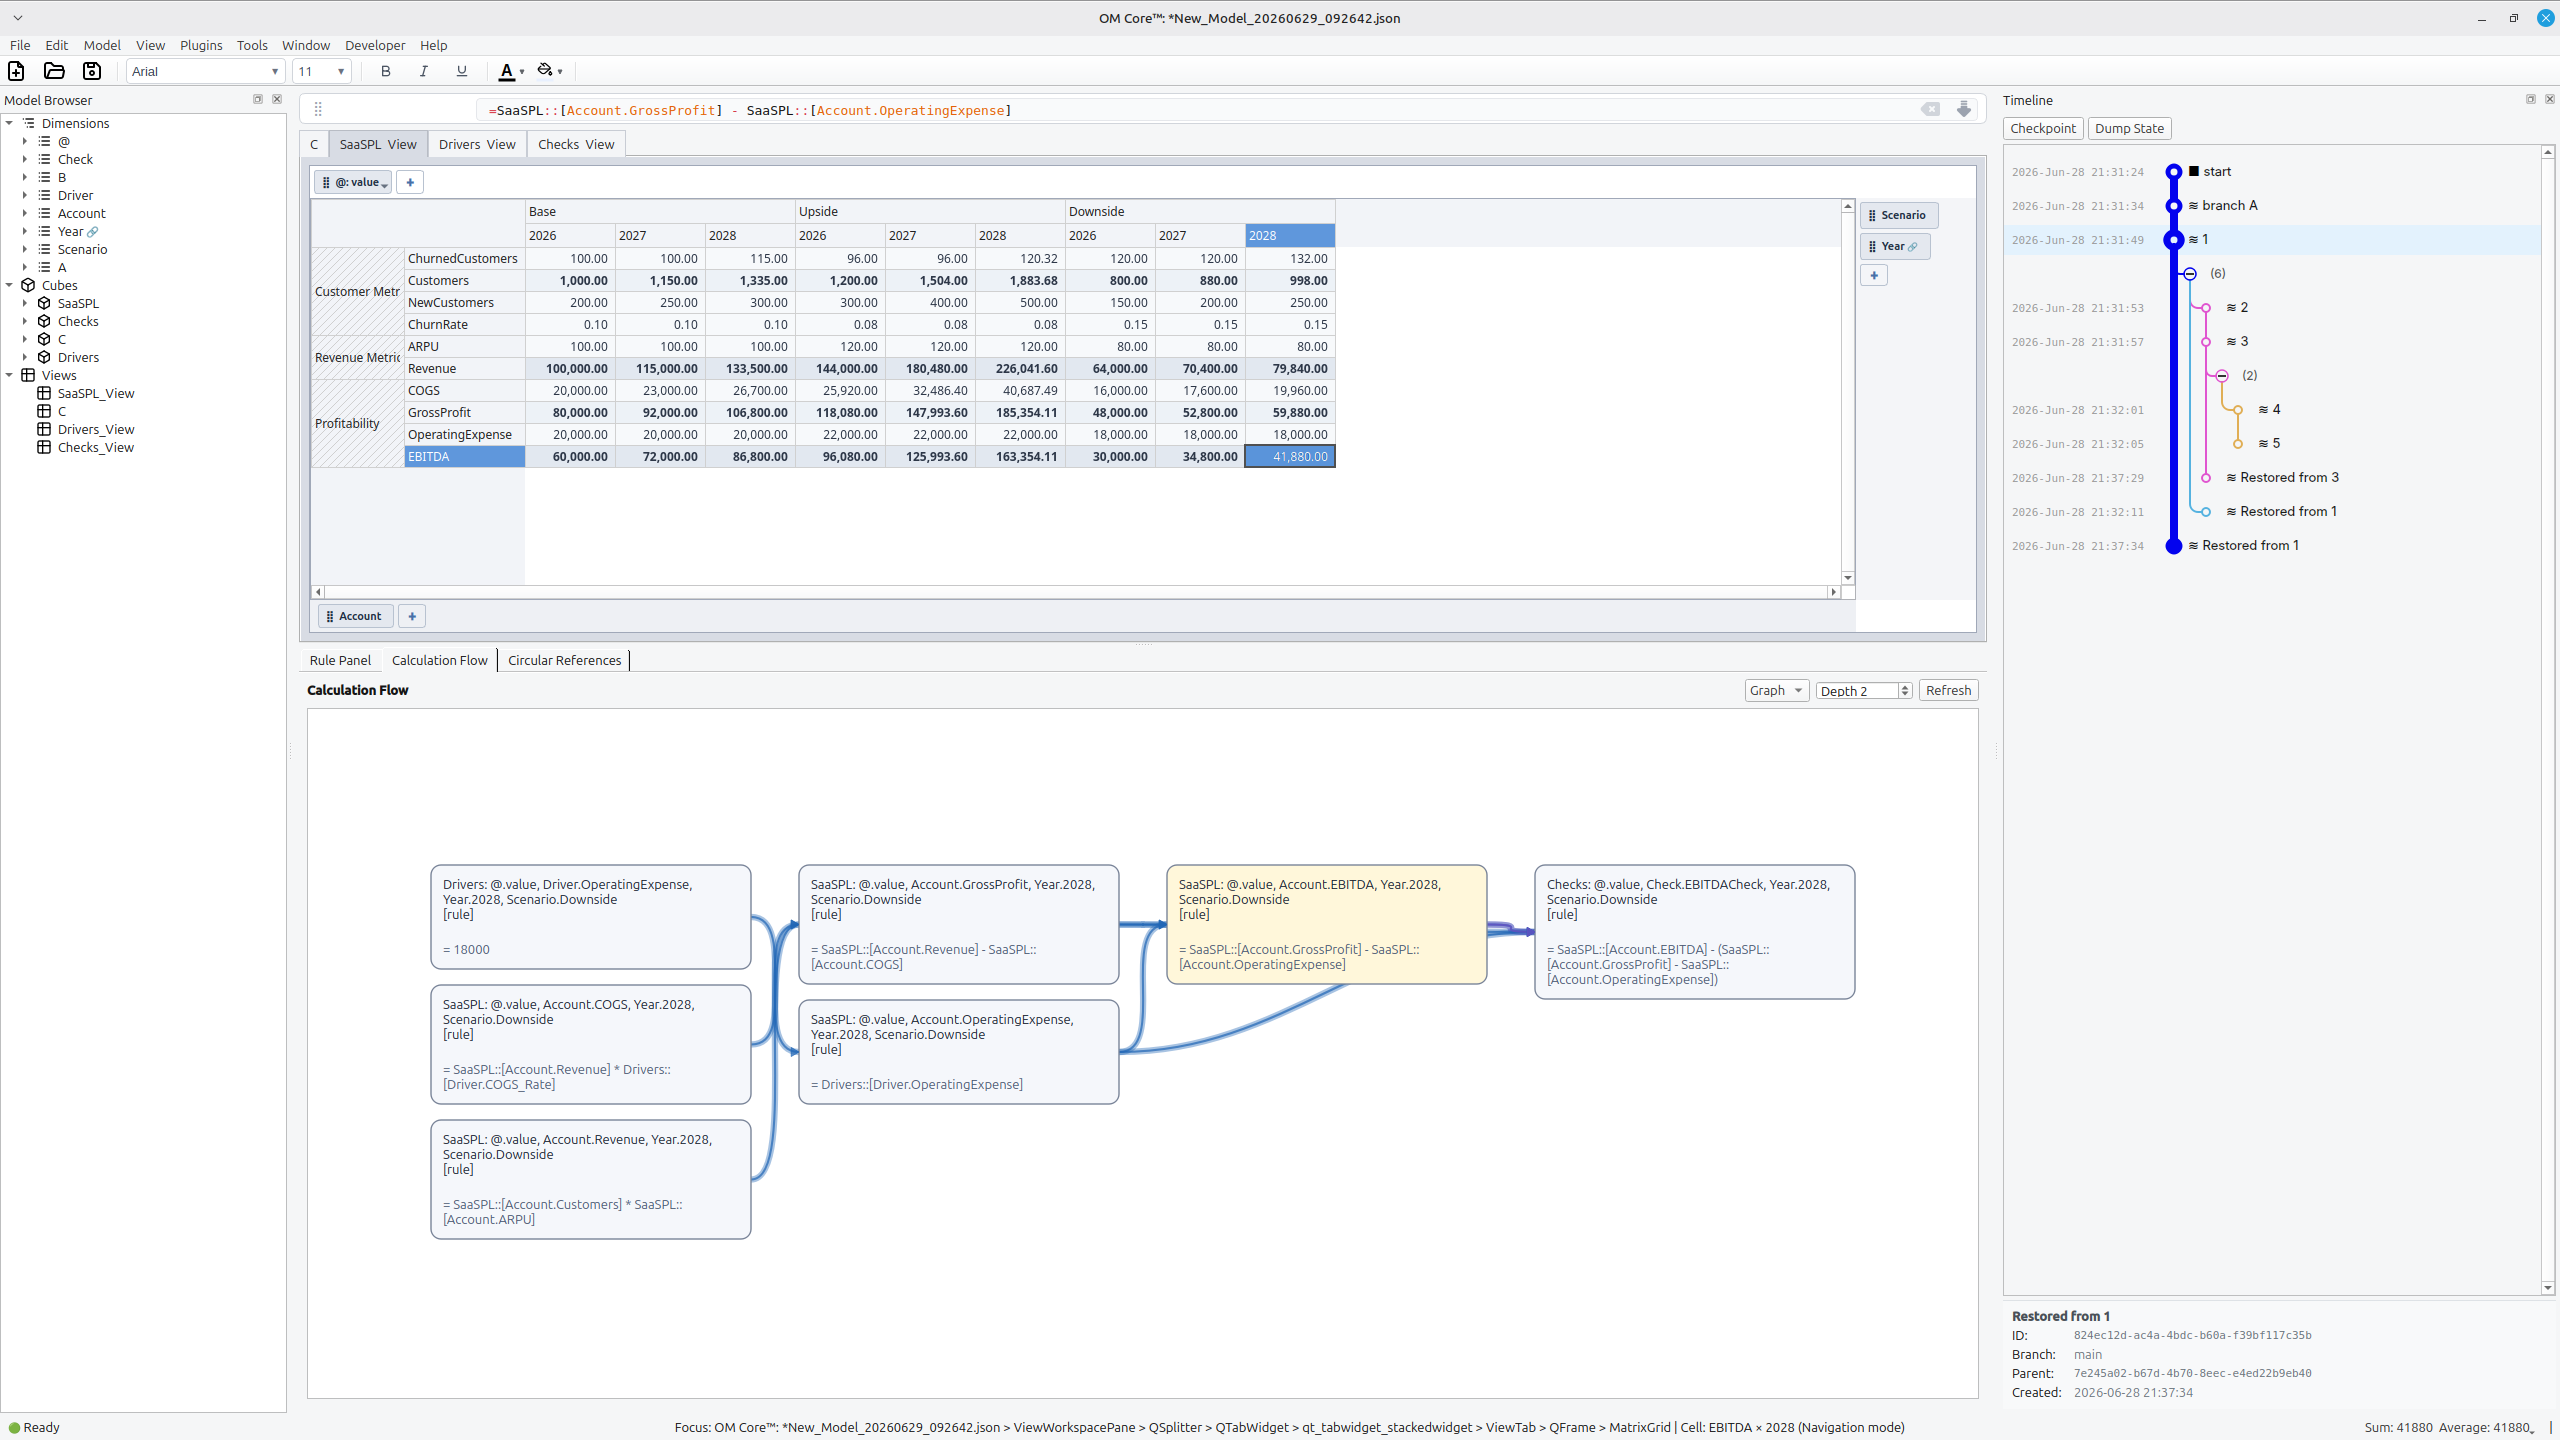
- Calculation Flow — a visual or textual trace of how the selected value depends on other cells.
- Circular References — diagnostics when a rule introduces a cycle.
The Rule Panel shows rules as semantic units. A rule is not tied to a specific cell coordinate; it is attached to a slice or a single cell address.
Timeline
The Timeline panel is on the right. It gives you control over the workspace state:
- Checkpoint — save a named snapshot of the current workspace.
- Dump State — export the current state for debugging or sharing.
Checkpoints help capture workspace state before experiments or debugging sessions.
Status bar
The status bar at the bottom shows:
- The current focus path, for example
Focus: OM Core View: New_Model_.... - The active cell address and mode, such as navigation mode.
- Summary statistics for the current selection, such as sum, average, and count.
Navigation basics
The interface supports both mouse and keyboard navigation:
- Click a view in the Model Browser to open it in the grid.
- Click a cell to inspect its value and rule.
- Use the arrow keys to move through dimension items.
- Use the Rule Panel tabs to switch between rules, calculation flow, and diagnostics.